Dashboards are the analytics hub of your operation in Nuvia. In three tabs, Customer Service, Campaigns and Funnel, you track real-time metrics on conversation volume, campaign performance and the health of your sales funnel. This article shows how to navigate the dashboards, apply filters, export data and read each metric.
Available on: All plans.
Who can do it: Administrator or Manager with view permission for the Dashboards module.
What you need before you start
-
Access to the Dashboards module
-
At least 1 day of data generated on the platform (active conversations, campaigns or funnels)
-
An up-to-date browser with JavaScript enabled, for the charts and filters
Key concepts
| Concept | What it is |
|---|---|
| Dashboard | A consolidated view of metrics on a specific area of the operation (customer service, campaigns or funnel) |
| Tab | A themed section of the dashboard. Each tab shows metrics for one area and has its own filters |
| Period | The time range selected to filter data (last 7, 30, 90 days or a custom range) |
| Filters
|
Criteria that narrow down the data (funnel, team, agent, channel, campaign). Most accept several options at once |
| Lag | Delay between the event and when it shows up. Customer Service and Funnel: about 5 minutes. Campaigns: up to 1 hour |
| Granularity | How data is grouped over time (daily, weekly or monthly), depending on the period |
Open Dashboards and switch between tabs
-
In the left sidebar, click Dashboards
-
The page loads on the Customer Service tab by default
-
At the top of the page, you'll see three tabs side by side:
-
Customer Service (default)
-
Campaigns
-
Funnel
-
-
Click any tab to switch between them
-
Filters and data reset when you change tabs
General tab layout
-
Filter row at the top (periods, channels, agents, etc.)
-
Summary cards (main KPIs in large numbers)
-
Charts (trend visualizations)
-
“Export tab as PDF” button in the top-right corner
Filter by period
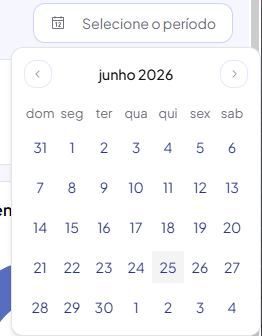
To limit the data to a given time range (in days), use the period filter. The period sits in a single field, with a two-month calendar.
-
In the filter bar, click the period field (example: 05/26/2026 – 06/27/2026) or Select period
-
In the calendar, click the start date and the end date
-
Click Apply. Cancel discards your choice (to remove the filter, just click the X next to the date)
Filter by several options at once
The Campaign, Funnel, Source campaign, Team and Agent filters accept several options at the same time. That way you can compare, for example, a group of campaigns or the whole team at once, without filtering one by one.
-
Click the filter and check as many options as you want
-
Use the search inside the filter to find an option by name
-
Use Select all and uncheck only what you don't want. With a search active, it applies only to the search results (e.g. all campaigns except “SP Campaign”)
-
Click Apply. The dashboard only reloads on Apply; Cancel or Esc discard the selection
Export a tab as PDF
-
Open the tab you want and set the filters and period
-
In the top-right corner, click Export tab as PDF
-
Confirm if prompted. The browser downloads the file
The PDF includes the export date and time, the period and filters applied, the KPI cards, the charts and the table.
Customer Service dashboard
Brings together conversation volume, response time, performance per agent and distribution by channel. You can filter by one or more funnels, teams or agents.
Customer Service dashboard summary cards
-
Total conversations: The sum of Closed, Open and Waiting.
-
Open: All conversations being handled right now.
-
Average per agent: Average number of ongoing conversations per agent in the period. It adds up the conversations being handled by people and divides by the number of agents with conversations at that moment — for example, one agent with 5 and another with 15 gives (5 + 15) ÷ 2 = 10. It helps you quickly see if the team is balanced, overloaded or idle. It's a read-only indicator (it doesn't open a breakdown) and follows the selected period.
-
Waiting: Conversations where the customer is taking a while to reply.
-
Closed: Conversations moved to closing stages.

Main Customer Service dashboard data
-
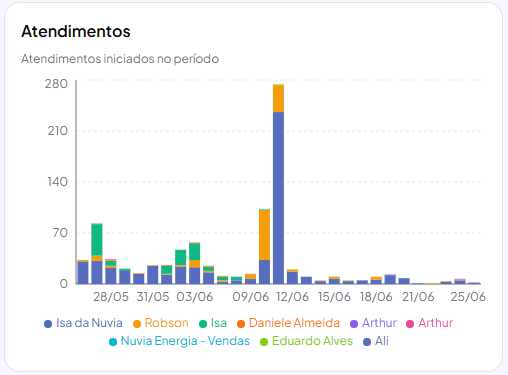
Conversations (stacked bars): Conversation volume per period, split by state. Good for spotting peaks and seasonality
-
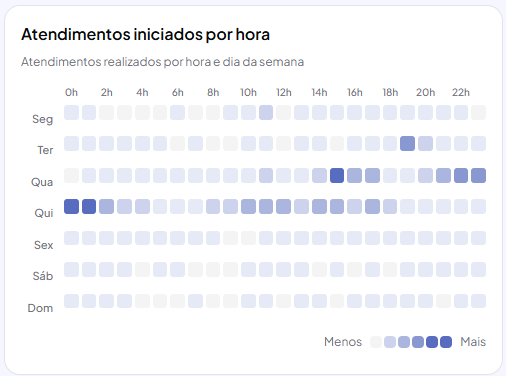
Conversations started per hour (heatmap): Shows the time slots and weekdays with the highest conversation volume. The darker the color, the more conversations started.
-
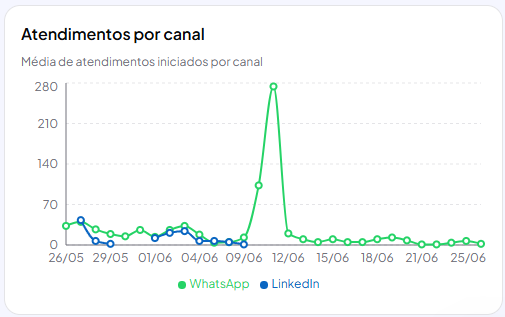
Conversations by channel (line): Conversation volume per channel (WhatsApp and others)
-
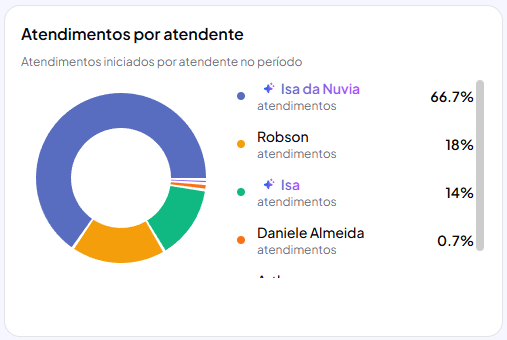
Agents (donut): Distribution of conversations across agents, useful to see if the workload is balanced.
-
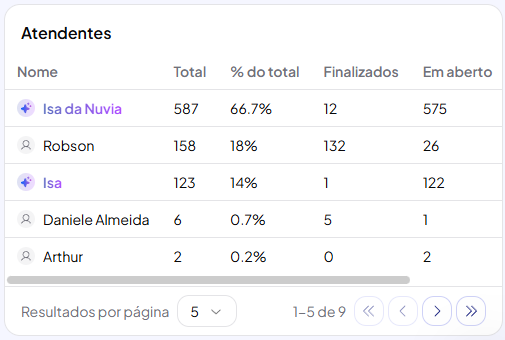
Agent performance (table): Performance metrics for each agent individually.
-
Closings by reason: Why conversations ended (Success, Discard or Other), when the company uses closing reasons. Automatic closings (30 days without activity, end of call, campaign, HubSpot) are hidden by default: to see them, check “Automatic” in the “Closed by” filter.
Campaigns dashboard
Brings together the reach, delivery, open and reply rates of your sends (WhatsApp, LinkedIn, Email).
Campaigns dashboard filters
You'll find the filters at the top of the dashboard, below the tabs for switching between dashboards.
-
Channel: View data for all channels or a specific channel.
-
Campaign: View data for all campaigns, or for one or several campaigns at once. Checking all counts as “All”.
-
Funnel: View data for campaigns from one or more funnels.

Campaigns dashboard summary cards
-
Total leads: Total number of leads mapped to the campaign.
-
Sent: Number of sends made to leads
-
Delivered: Number of sends delivered to leads, out of those sent
-
Replied: Number of leads who replied, out of those delivered
-
Converted: Number of leads converted, out of those who replied
-
Failed: Number of failures, out of those sent.

Main Campaigns dashboard data
-
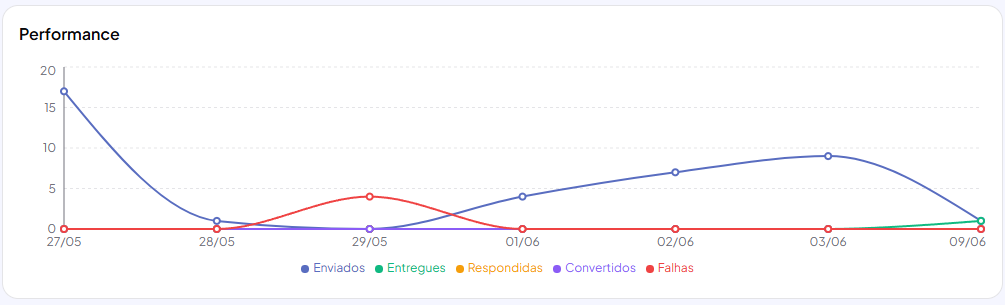
Campaign performance (line): Shows how the campaign's performance evolves over time.
-
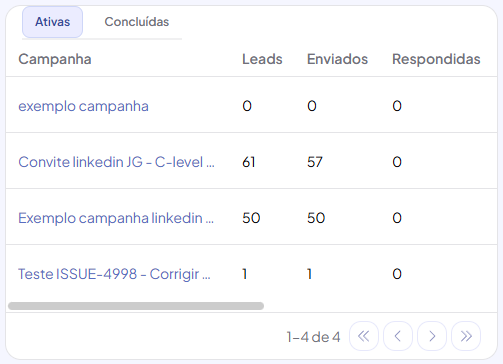
Overview of active and completed campaigns (table): Overview of the data from active and completed campaigns.
-
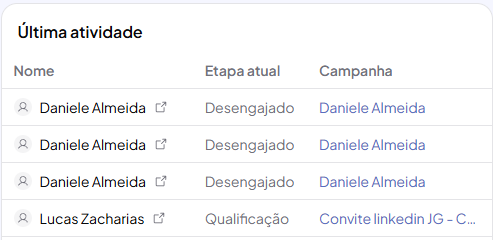
Latest activity in a campaign (table): The latest lead movements within the campaign.
Funnel dashboard
Brings together the reach, delivery, open and reply rates of your sends (WhatsApp, LinkedIn, Email).
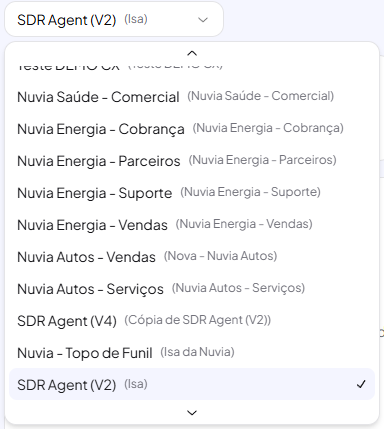
Filter by Smart Funnel (AI agent)
Funnel data is shown for the one you select. You can also filter by one or more source campaigns.
Funnel dashboard summary cards
-
Total leads: Total number of leads in the funnel
-
Total won: Total number of leads converted, out of the total leads
-
Total lost: Total number of leads lost, out of the total leads
-
Total open: Total number of leads with an ongoing conversation
-
Average handoff time: Average time for the AI to hand off to a human

Main Funnel dashboard data
-
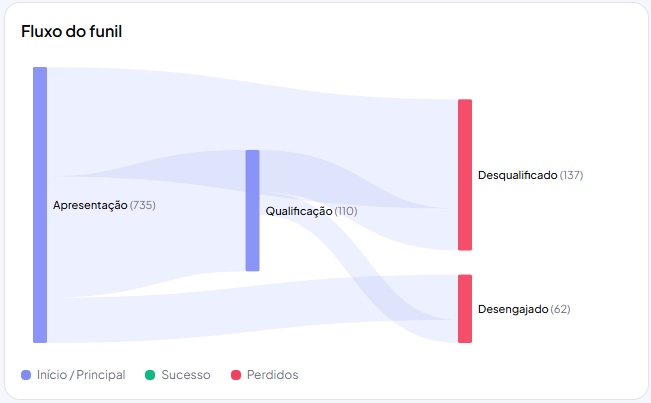
Funnel flow (waves): Overview of how leads move through the funnel
-
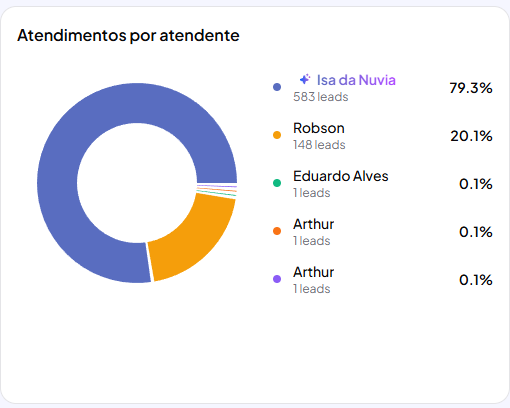
Conversations per agent (donut): Distribution of conversations across agents.
-
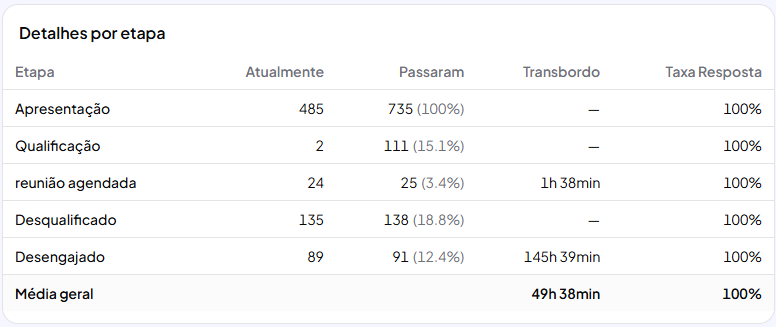
Details by stage (table): Performance data split by funnel stage.
-
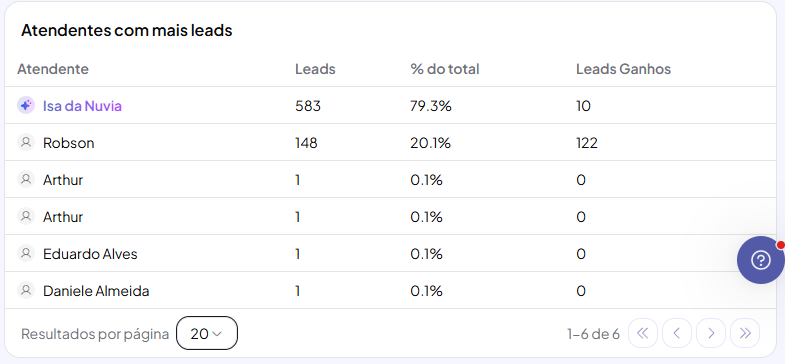
Agents with the most leads (table): Agent performance data in handling leads.